Getting Started: Opacity and CIA Data
Every TauREx simulation is driven by tabulated molecular data — cross-sections that encode how strongly each gas absorbs at each wavelength, and CIA tables for the continuum opacity of background gases. This notebook gets those files in place so that the rest of the series can focus entirely on building and interpreting atmospheric models.
Two kinds of external data are needed:
Molecular cross-sections (opacities) — wavelength-dependent absorption coefficients for each gas species (e.g., H₂O, CH₄), distributed in HDF5 format by communities such as ExoMol and HITRAN.
Collision-Induced Absorption (CIA) files — continuum opacity from molecular pairs (e.g., H₂–H₂, H₂–He), important for the spectral baseline in hydrogen-dominated atmospheres.
TauREx supports several cross-section formats: ExoMolOP HDF5, legacy TauREx 2 pickle, and ExoTransmit. For CIA, both HITRAN .cia and legacy .db formats are accepted, and additional formats can be added through plugins.
Once the files are in place, TauREx’s caching system discovers them automatically — path configuration is a one-time step. More information about input-file conventions is here, and global path settings are here.
[1]:
from _shared import CIA_DIR, PROJECT_ROOT, SRC_DIR, TMP_DIR, XSEC_DIR, ensure_opacity_data

print(f'Project root: {PROJECT_ROOT}')
print(f'Source directory: {SRC_DIR}')
print(f'Temporary data directory: {TMP_DIR}')
print(f'Cross-sections directory: {XSEC_DIR}')
print(f'CIA directory: {CIA_DIR}')
Project root: /home/simone/Dropbox/eScience_projects/TauRex/taurex3
Source directory: /home/simone/Dropbox/eScience_projects/TauRex/taurex3/src
Temporary data directory: /home/simone/Dropbox/eScience_projects/TauRex/taurex3/examples/tmp
Cross-sections directory: /home/simone/Dropbox/eScience_projects/TauRex/taurex3/examples/tmp/xsec
CIA directory: /home/simone/Dropbox/eScience_projects/TauRex/taurex3/examples/tmp/cia
Downloading Opacity Files
The ensure_opacity_data helper fetches a small example dataset if it is not already present locally, then registers the download directory with the TauREx caches. Existing files are reused rather than re-downloaded, so running this cell a second time is instant.
[2]:
ensure_opacity_data(download=True)

xsec_files = sorted(path.name for path in XSEC_DIR.glob('*.h5'))
cia_files = sorted(path.name for path in CIA_DIR.glob('*.cia'))

print('Opacity data are available and the TauREx caches are configured.')
print(f'Found {len(xsec_files)} cross-section files: {xsec_files}')
print(f'Found {len(cia_files)} CIA files: {cia_files}')
Opacity data are available and the TauREx caches are configured.
Found 4 cross-section files: ['12C-16O2__UCL-4000.R15000_0.3-50mu.xsec.TauREx.h5', '12C-1H4__MM.R15000_0.3-50mu.xsec.TauREx.h5', '14N-1H3__CoYuTe.R15000_0.3-50mu.xsec.TauREx.h5', '1H2-16O__POKAZATEL__R15000_0.3-50mu.xsec.TauREx.h5']
Found 2 CIA files: ['H2-H2_eq_2018.cia', 'H2-He_eq_2011.cia']
Verifying the Cache
Once the cache is configured, OpacityCache reports the molecules it found. This is a useful sanity check before building a model — if a molecule does not appear here, it will not be available as an active gas in Temperature, pressure, and chemistry.
[3]:
from taurex.cache import OpacityCache

print('Molecules discovered by the opacity cache:')
OpacityCache().find_list_of_molecules()
Molecules discovered by the opacity cache:
[3]:
{'CH4', 'CO2', 'H2O', 'NH3'}
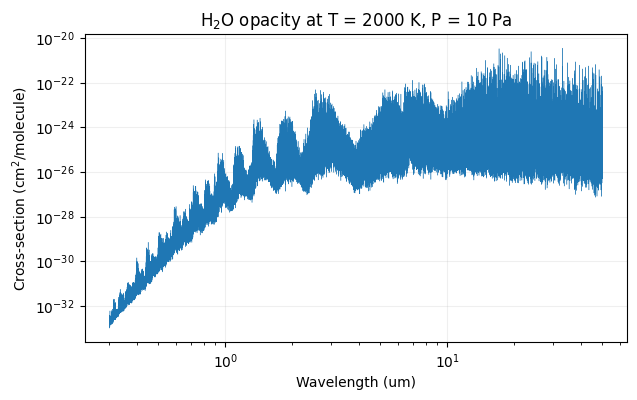
Inspecting a Cross-Section
Retrieving a cross-section object from the cache gives direct access to the raw opacity data. The opacity(temperature, pressure) method evaluates the absorption at a chosen temperature and pressure and returns it on the native wavenumber grid in units of cm\(^2\)/molecule.
[4]:
import matplotlib.pyplot as plt
import numpy as np

h2o_xsec = OpacityCache()['H2O']
wlgrid = 10000 / h2o_xsec.wavenumberGrid

plt.figure(figsize=(7, 4))
plt.plot(wlgrid, h2o_xsec.opacity(2000, 1e1), lw=0.3)
plt.xscale('log')
plt.yscale('log')
plt.xlabel('Wavelength (um)')
plt.ylabel('Cross-section (cm$^2$/molecule)')
plt.title('H$_2$O opacity at T = 2000 K, P = 10 Pa')
plt.grid(alpha=0.2)